Local Statistics
How to Use These Live StatsThe charts below update automatically every month from our MLS. Hover or tap on any point in the graph to see the exact numbers for that month. Use them to track prices, days on market, and inventory so you can time your move with real data instead of headlines.
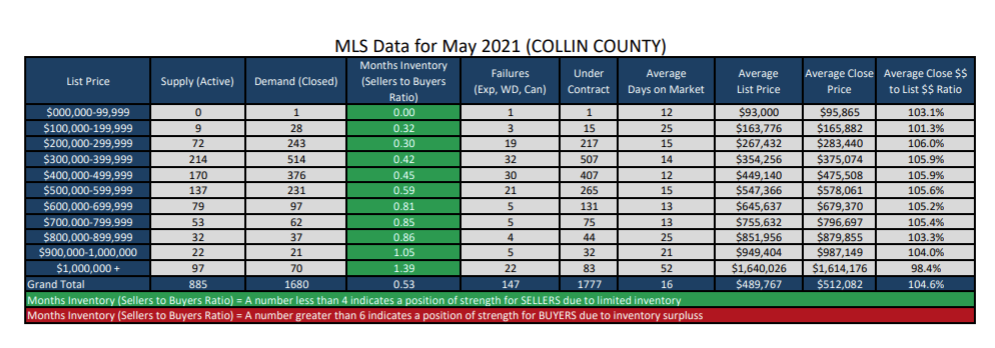
Collin County
Collin vs Entire MLS (Median Price)
This rolling graph shows how Collin County home prices are trending over time so you can see if the market is moving up, flat, or softening.
Collin County – % of Original List Price
See what homes are actually selling for compared to list price and how much room there is to negotiate in today's market.
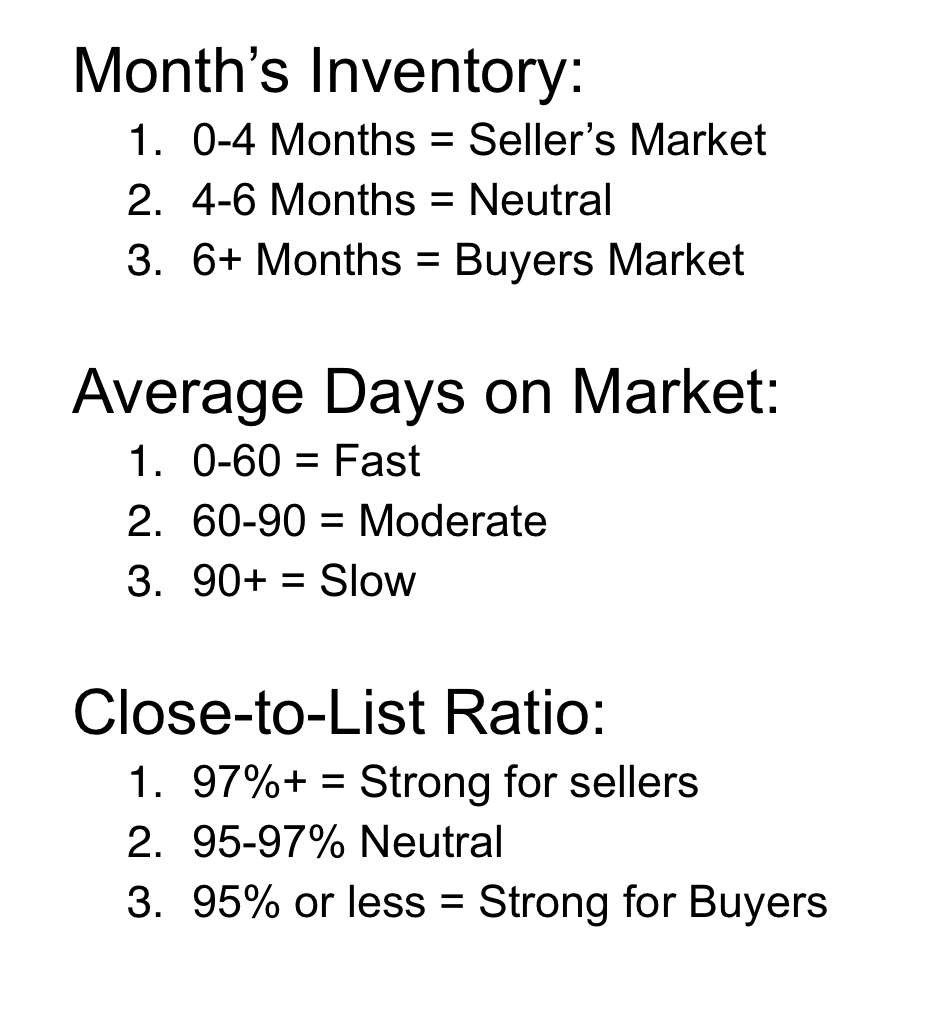
Collin County – Months of Inventory
This shows whether we're in a seller's, buyer's, or more balanced market based on how many months of homes are available.
Collin County – Closed Sales
This shows how many homes are actually closing each month in Collin County. It's a real‑time pulse on buyer activity so you can see if demand is heating up, cooling down, or staying steady.
Plano – Median Sales Price
|
Get Your Quick Home Value